Recently, a friend showed me Azure SRE and its incredible capability to investigate, well, anything really. When I saw this, it got me wondering…
Much like I’ve had in the past, with dreams of having iPads mounted in car dashboards (ie, CarPlay as we have it today) and “Apple style device provisioning for Microsoft devices” (ie, Autopilot as we have it today), I’ve recently been thinking that it would be really cool to have CoPilot delve into Event Viewer and diagnose problems for EUC devices. A few months ago, I published a blog about Integrating Microsoft Graph API with Claude AI Desktop which does go some way to making this possible, albeit with non-Microsoft-native AI.
This is a two-part blog on getting end user devices to push Windows Event Logs into Log Analytics, and then, leveraging Azure SRE to dig into those logs to identify any problems. This article shows how to get your devices writing to Log Analytics.
How to configure and deploy the Azure Arc agent
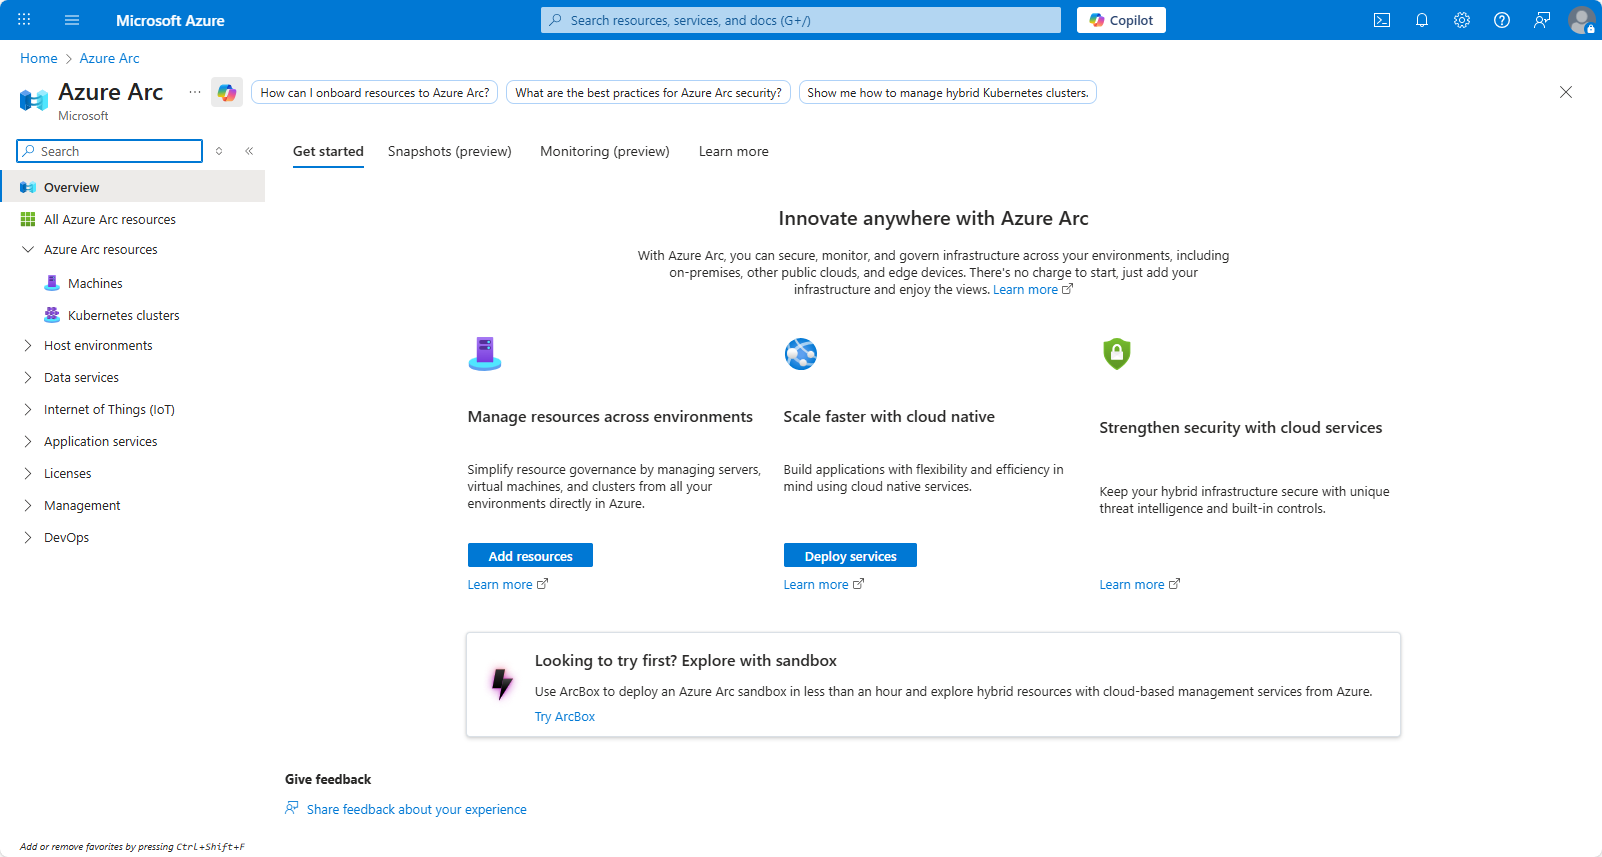
Login to Azure and search for Azure Arc in the search box.
From the overview page, click Add Resources
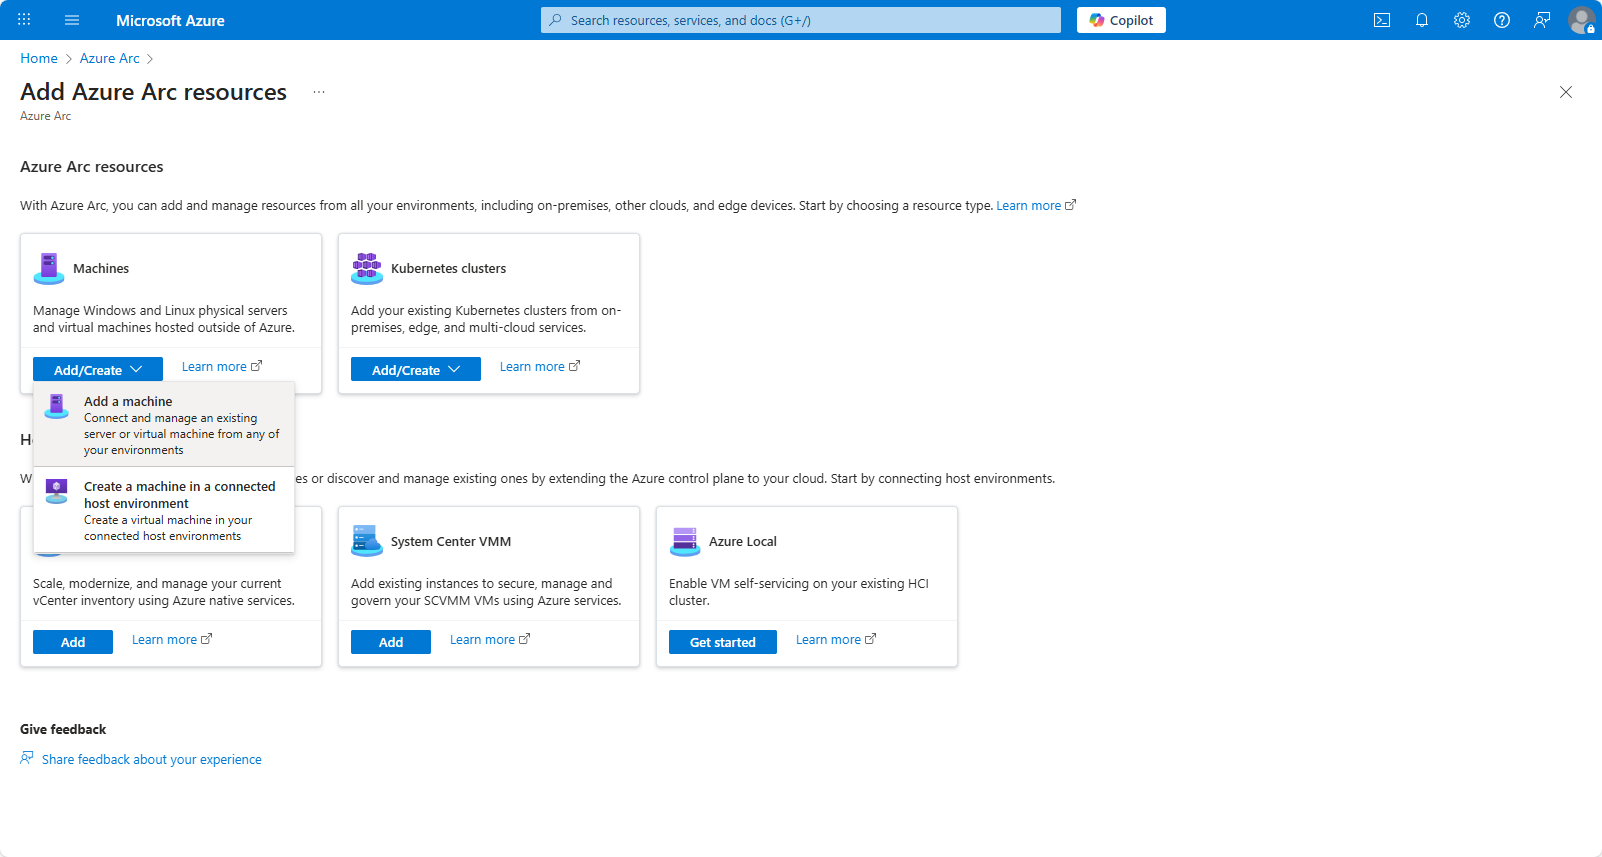
Under Machines, select Add/Create, and choose Add a Machine (assuming this isn’t an Azure resource already)
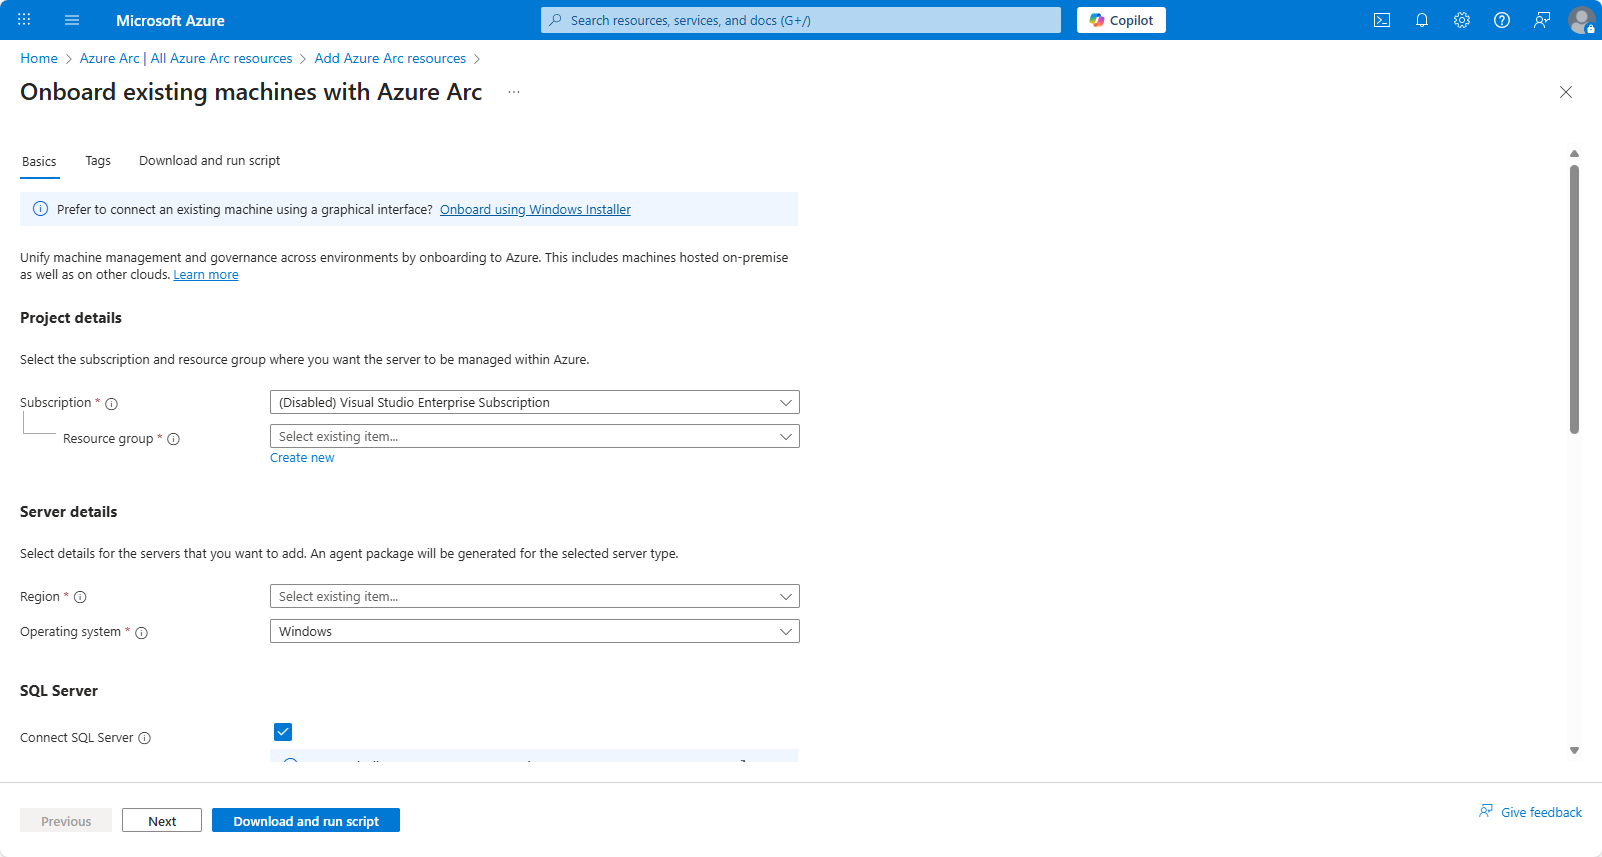
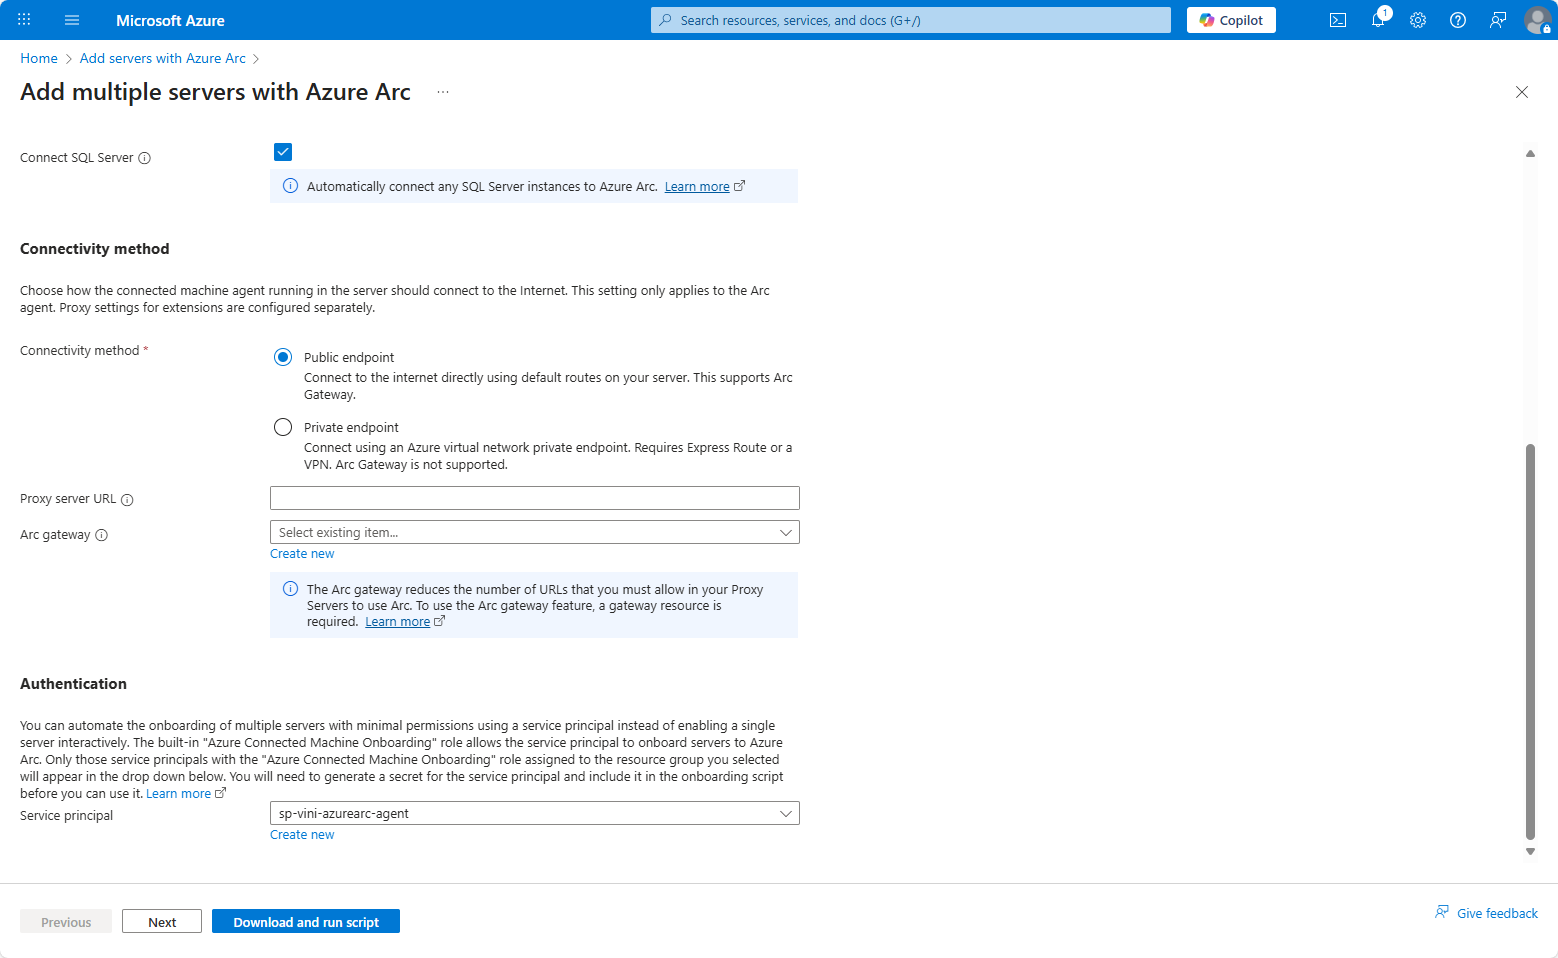
Input the required options on the “Onboard existing machines with Azure Arc” page.
If you don’t have a Resource Group, you can create one from within this wizard. Equally, I show how to create a Service Principal to automatically authenticate the devices, this too can be created within this wizard (down towards the bottom).
For workstations, you’ll almost certainly want to uncheck the “Connect SQL Server” option. People don’t run SQL on workstations these days, do they?
As mentioned above, under Authentication we can choose to create a new service principal, a new flyout wizard will open and guide you through this process. Be sure to capture the credentials issued at the end.
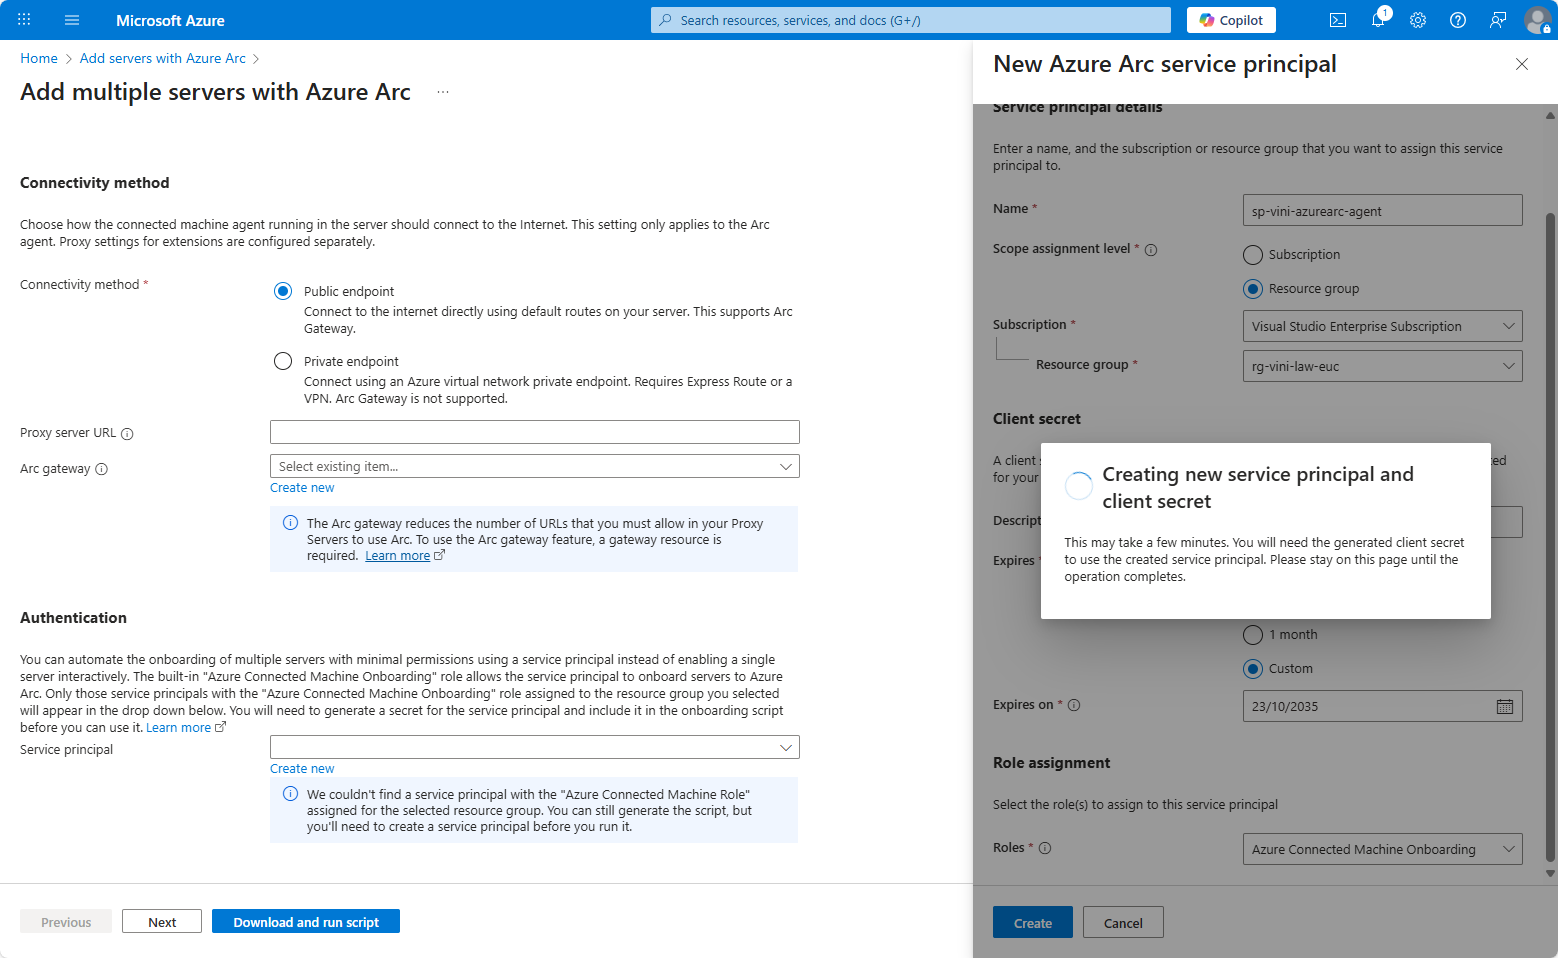
After the Service Principal is created and selected for use, click next.
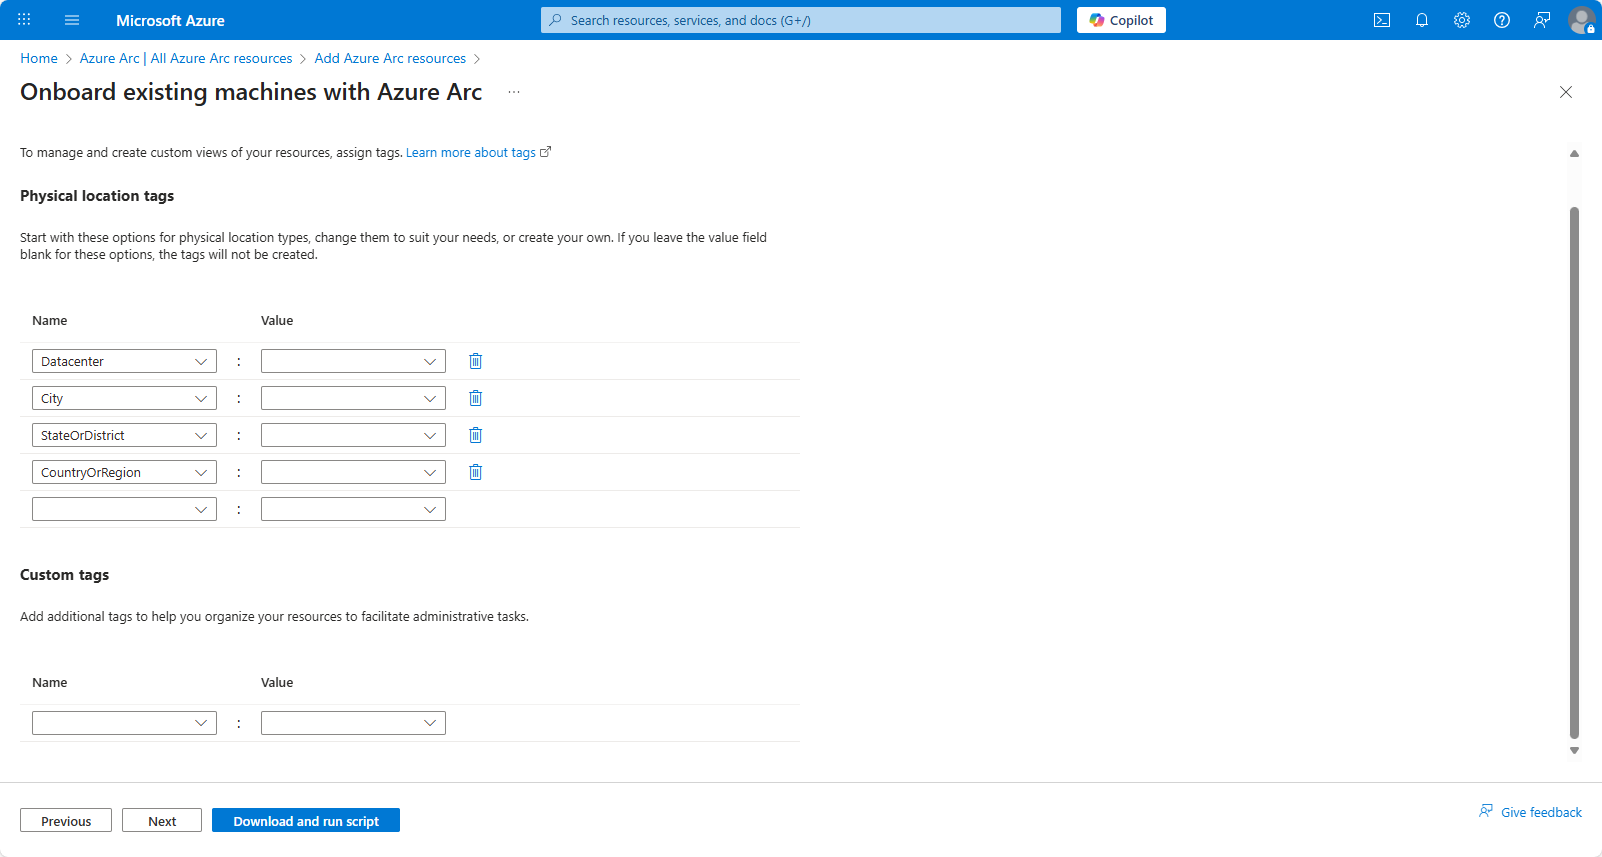
Input any Tags used by your environment and click next.
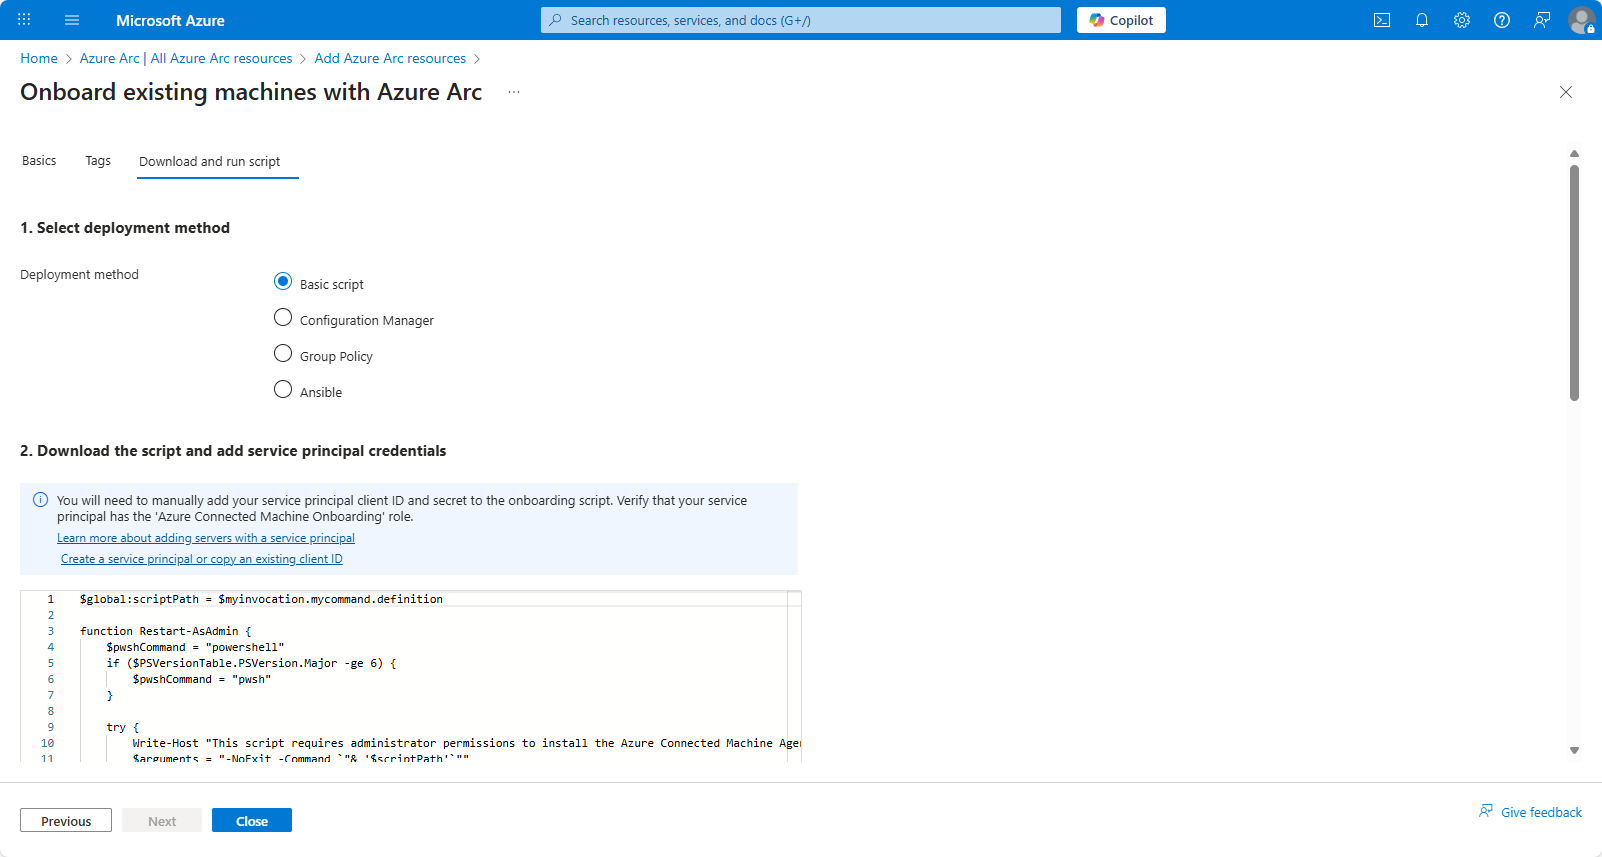
On the final step, you’re given the “deployment” choice. Select Basic script.
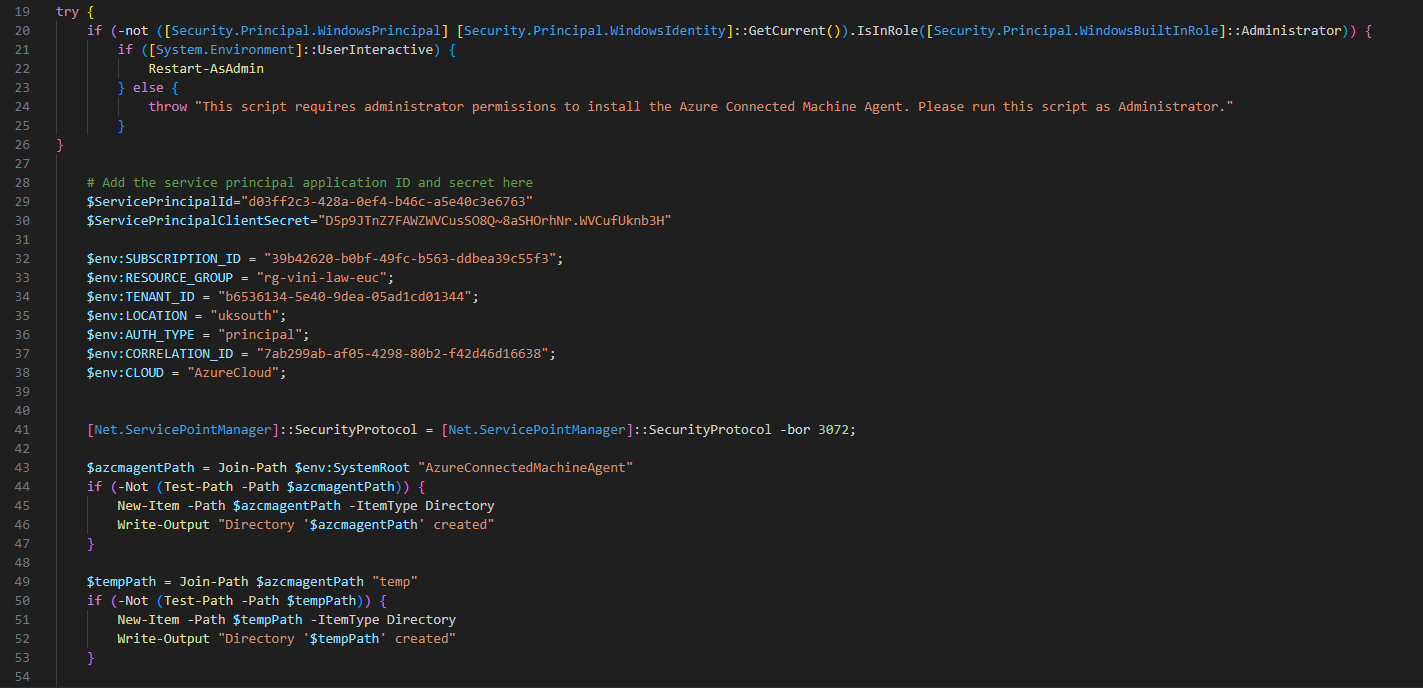
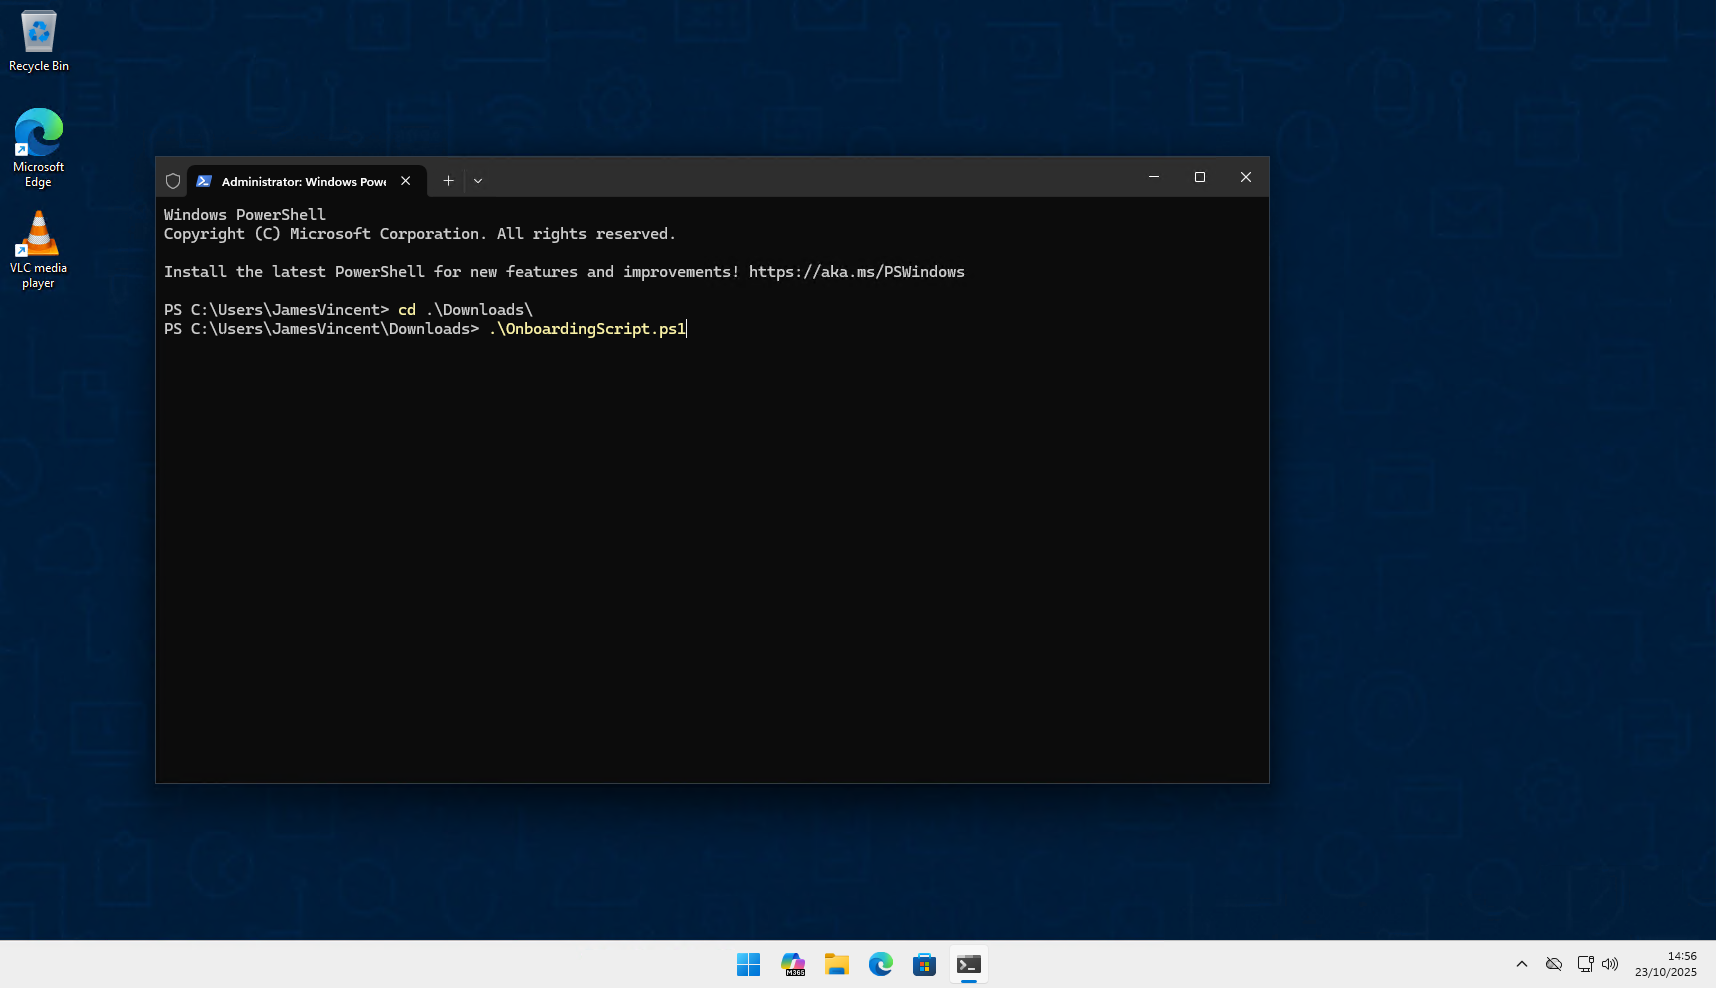
The script we’ve downloaded needs editing, to include the Service Principal credentials from the steps created above. See line 29 + 30. Save the script.
With the script updated, you would look to upload this to Intune, or Config Manager for deployment in bulk. However, for testing purposes/sake of this document, we’re running it locally, on one device.
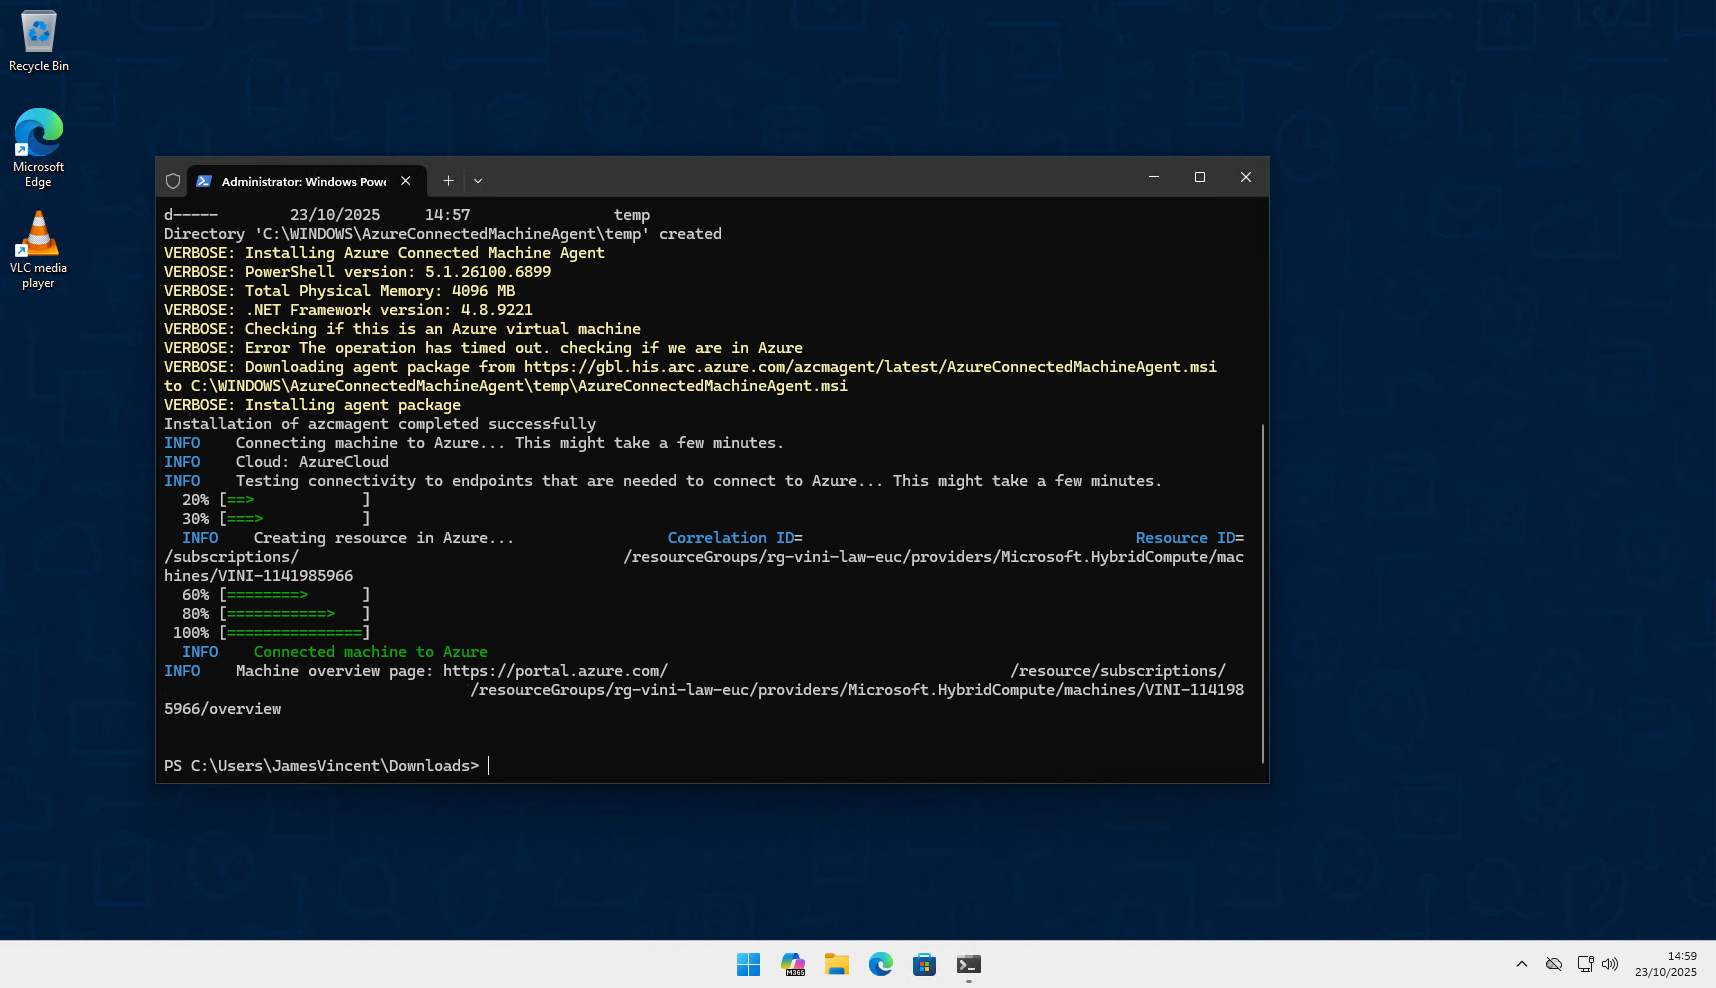
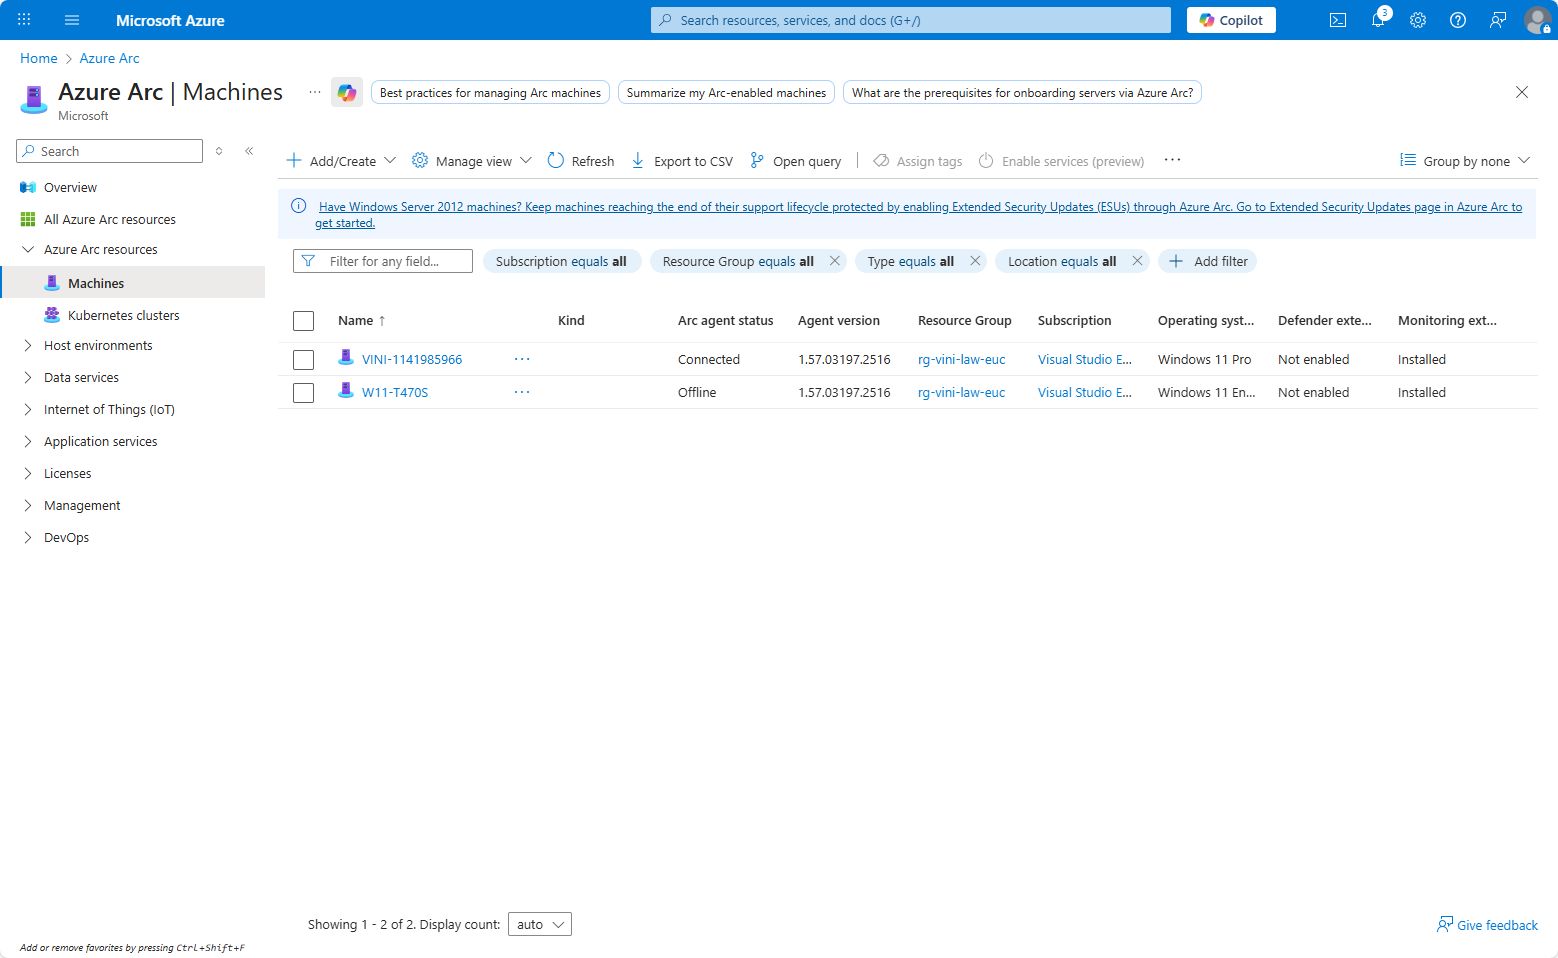
Once the script is installed, you’ll see the device is now registered within Azure Arc, under Machines.
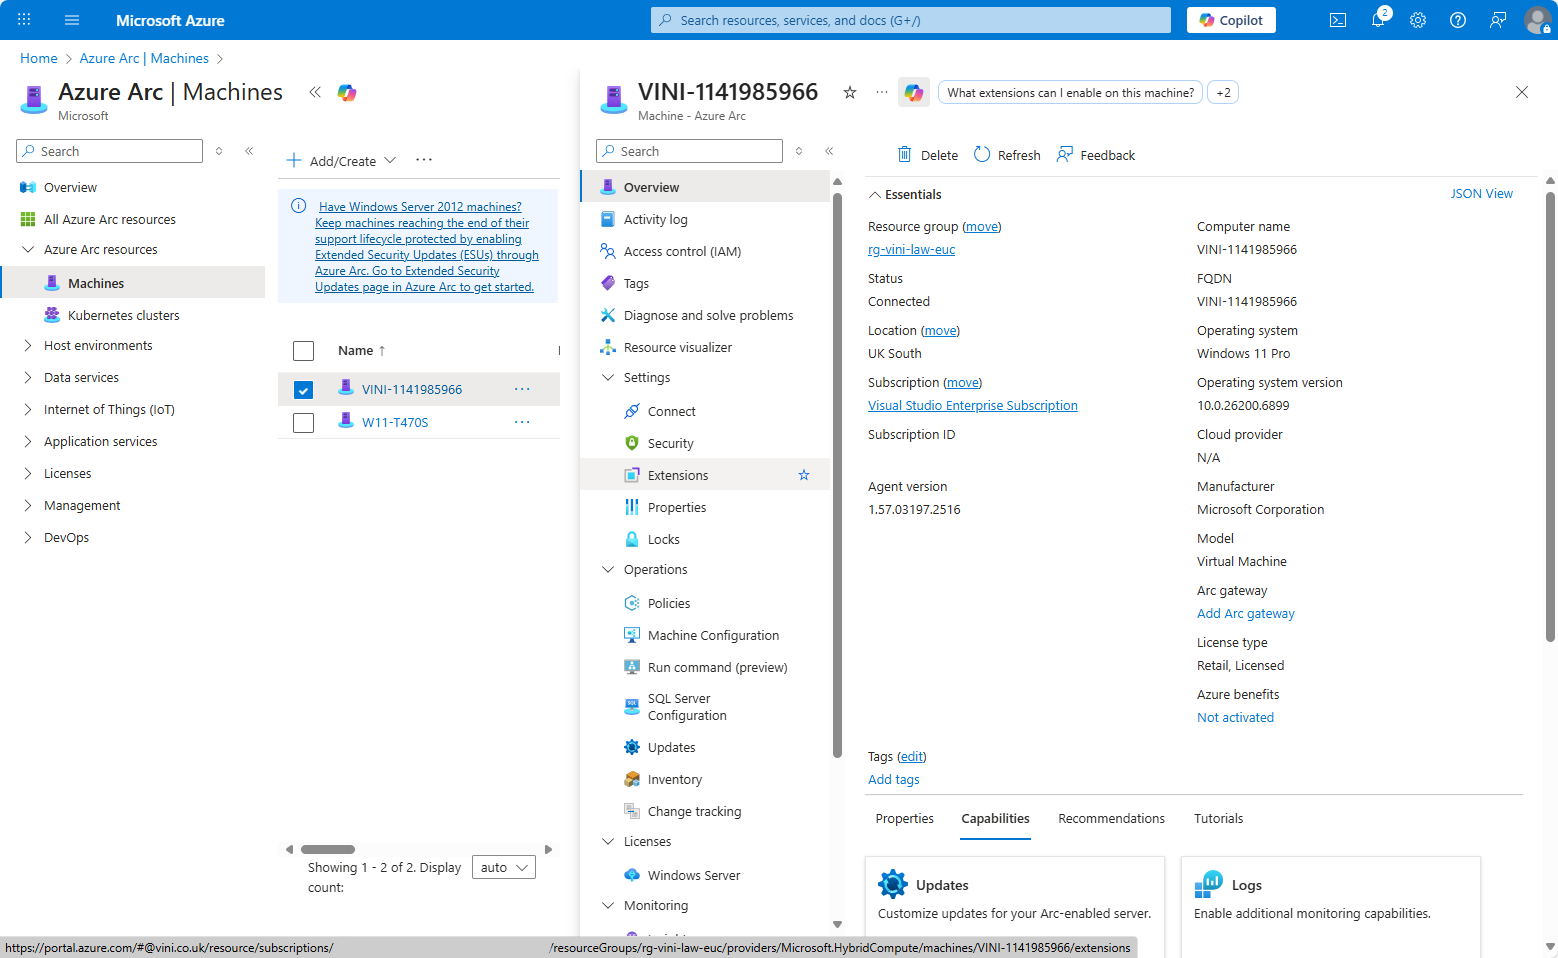
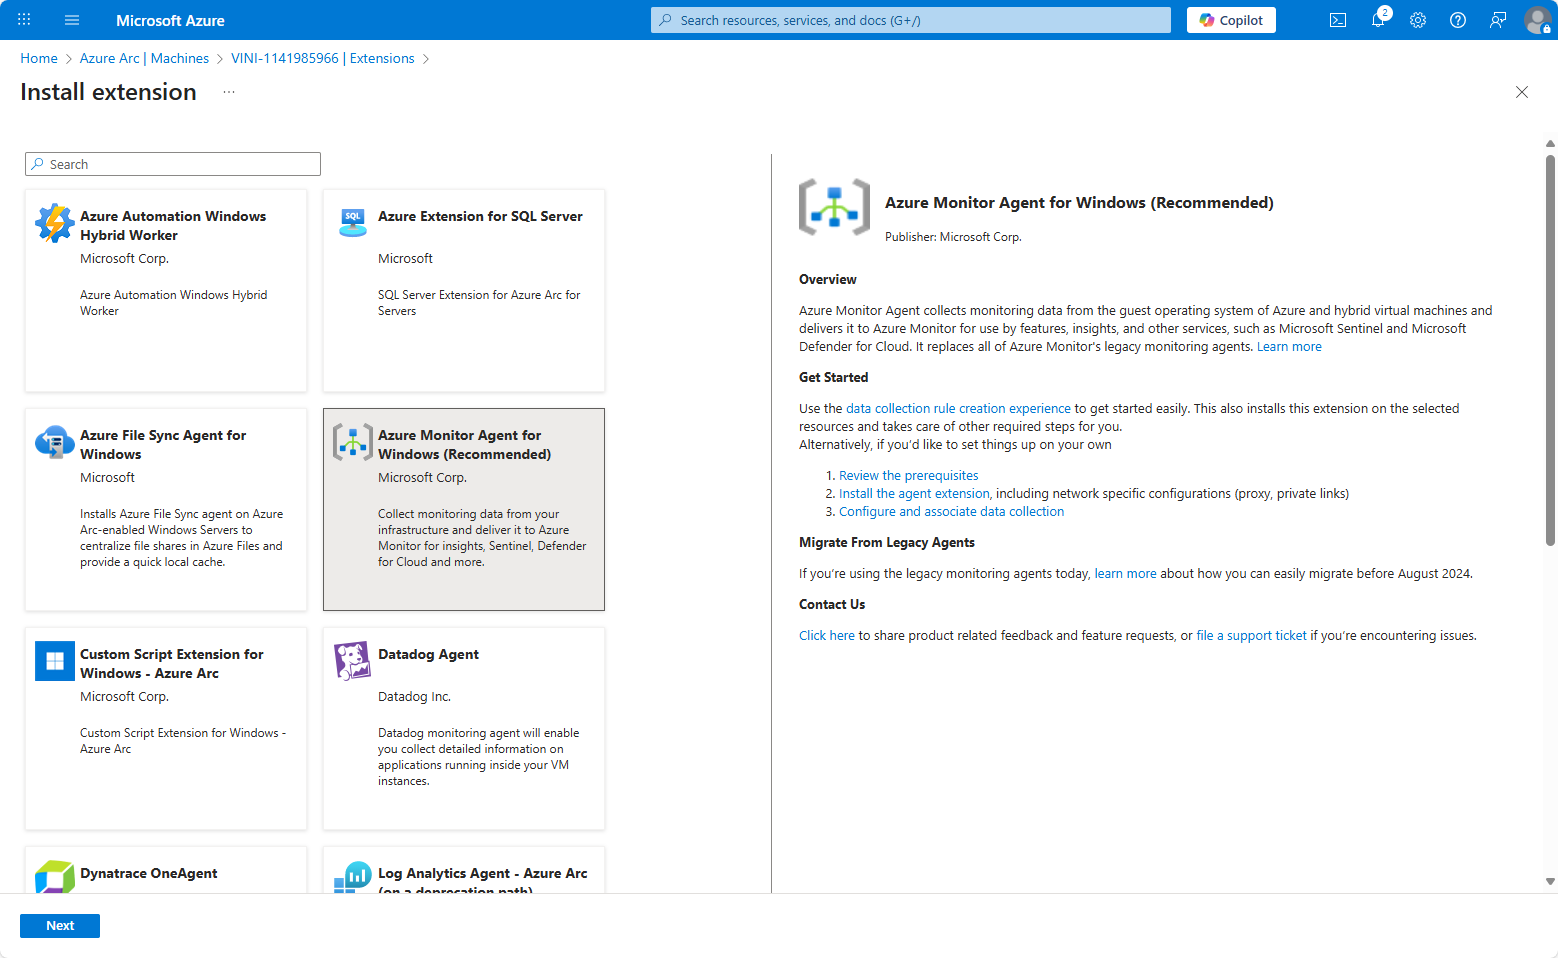
From the Machine object, go to Extensions. We want to install the Azure Monitoring Agent and ensure it is set to self-update. Click Add.
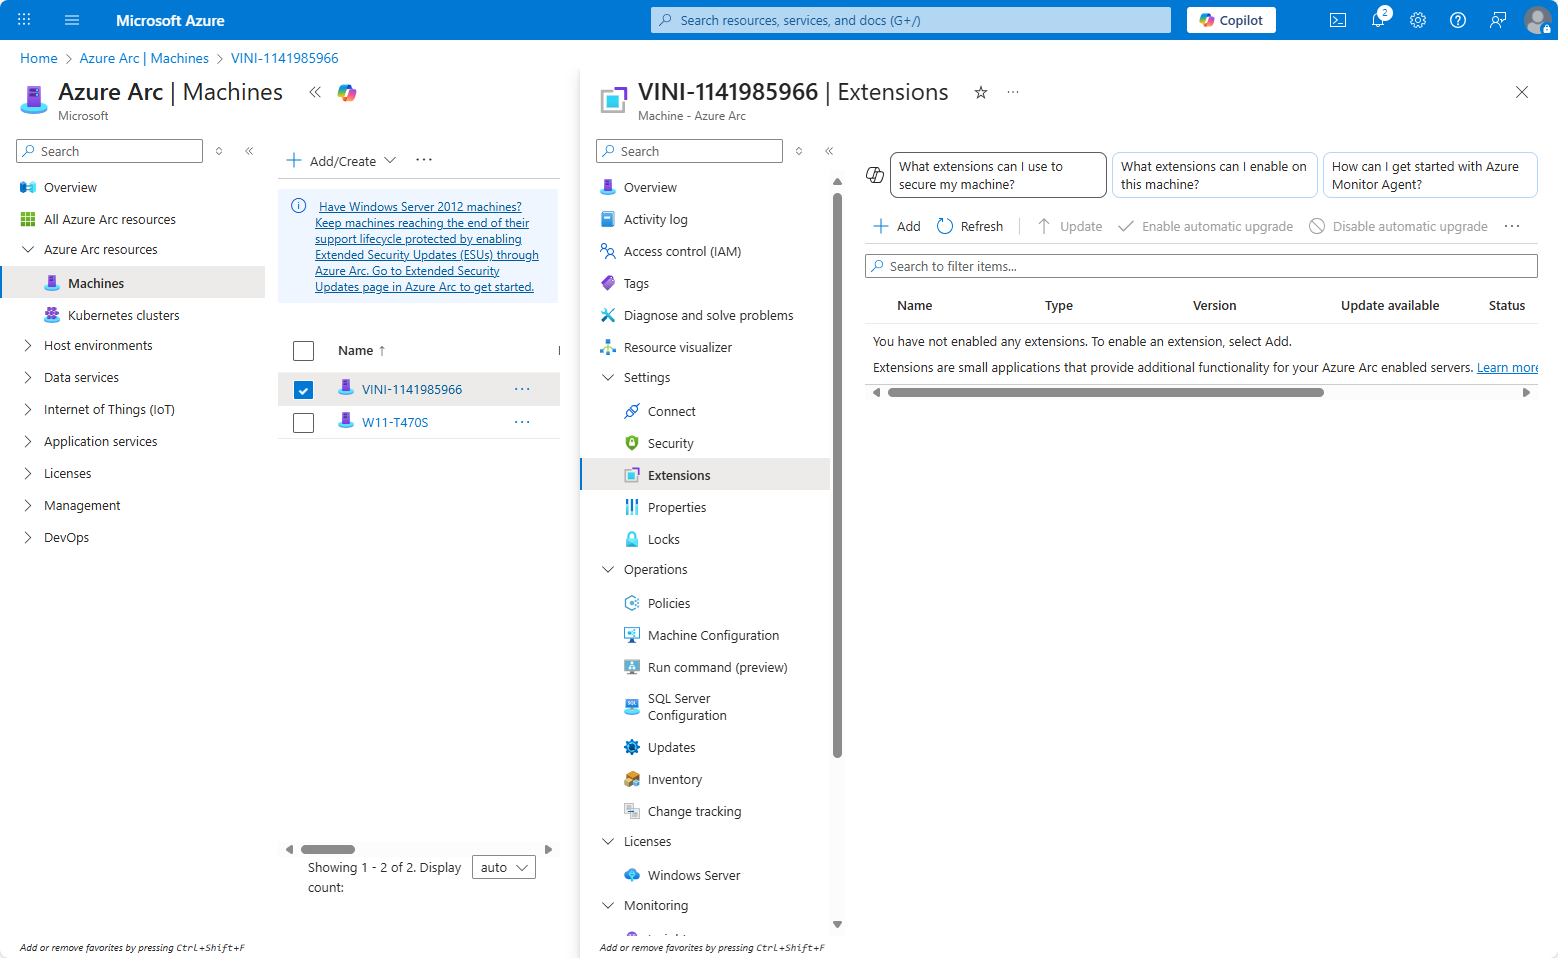
Select “Azure Monitor Agent for Windows” and next.
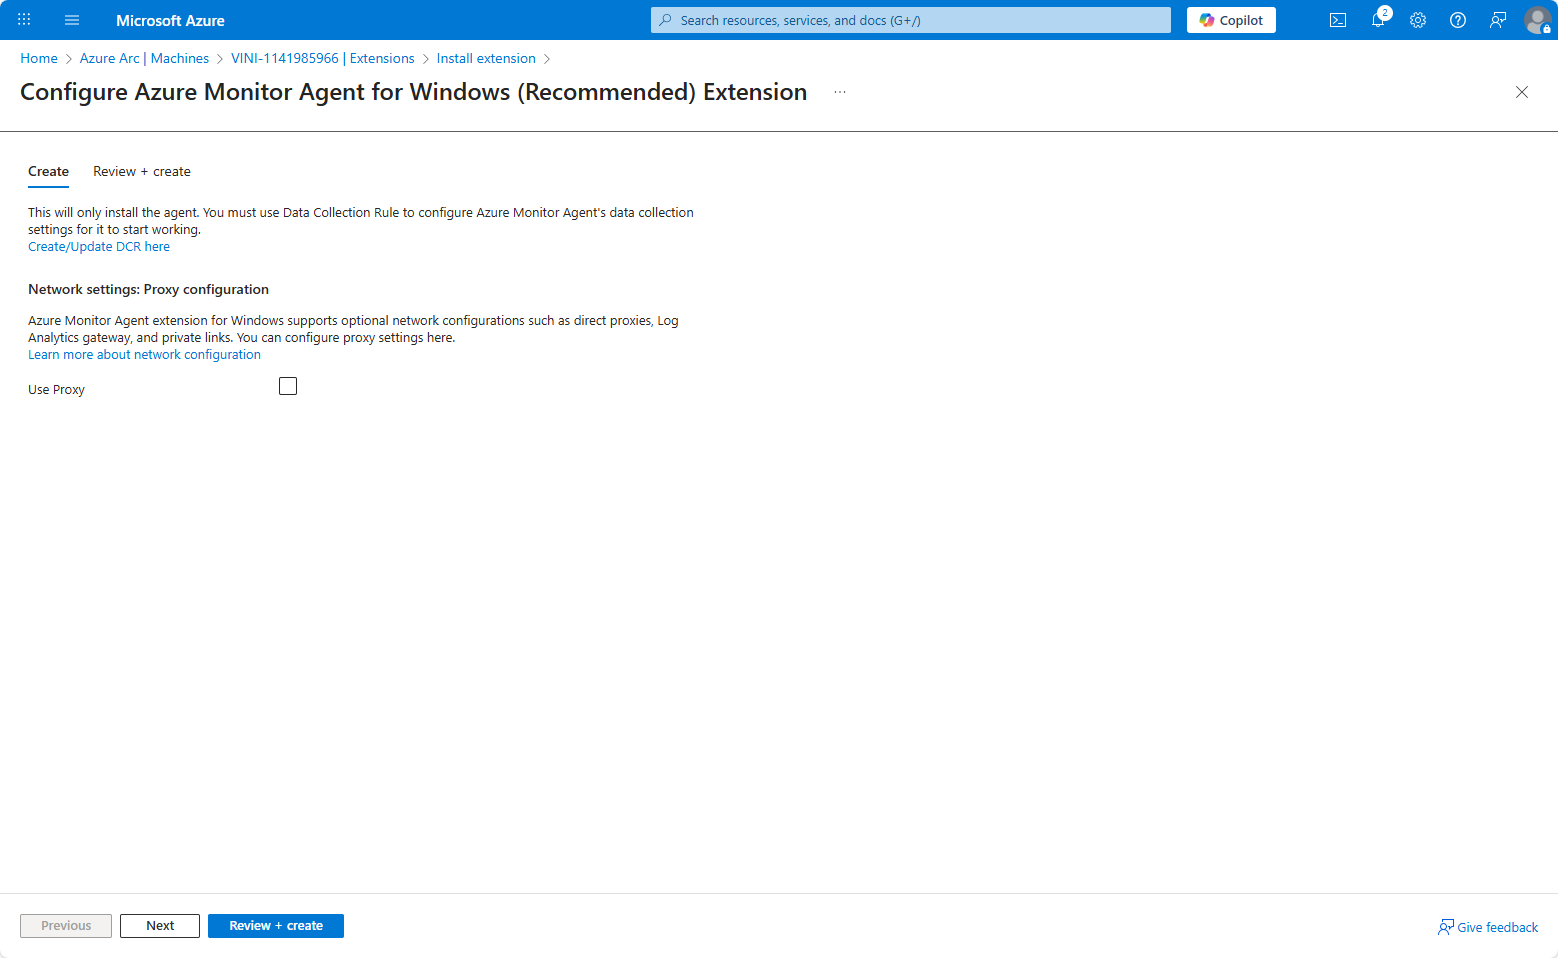
We need to create a Data Collection Rule, to inform the agent what we’re monitoring/data we’re collecting. Again, the wizard allows this to be created on the fly. Click Create/Update DCR here. This will trigger another wizard, in which we can stipulate we wish to collect Windows Event Logs.
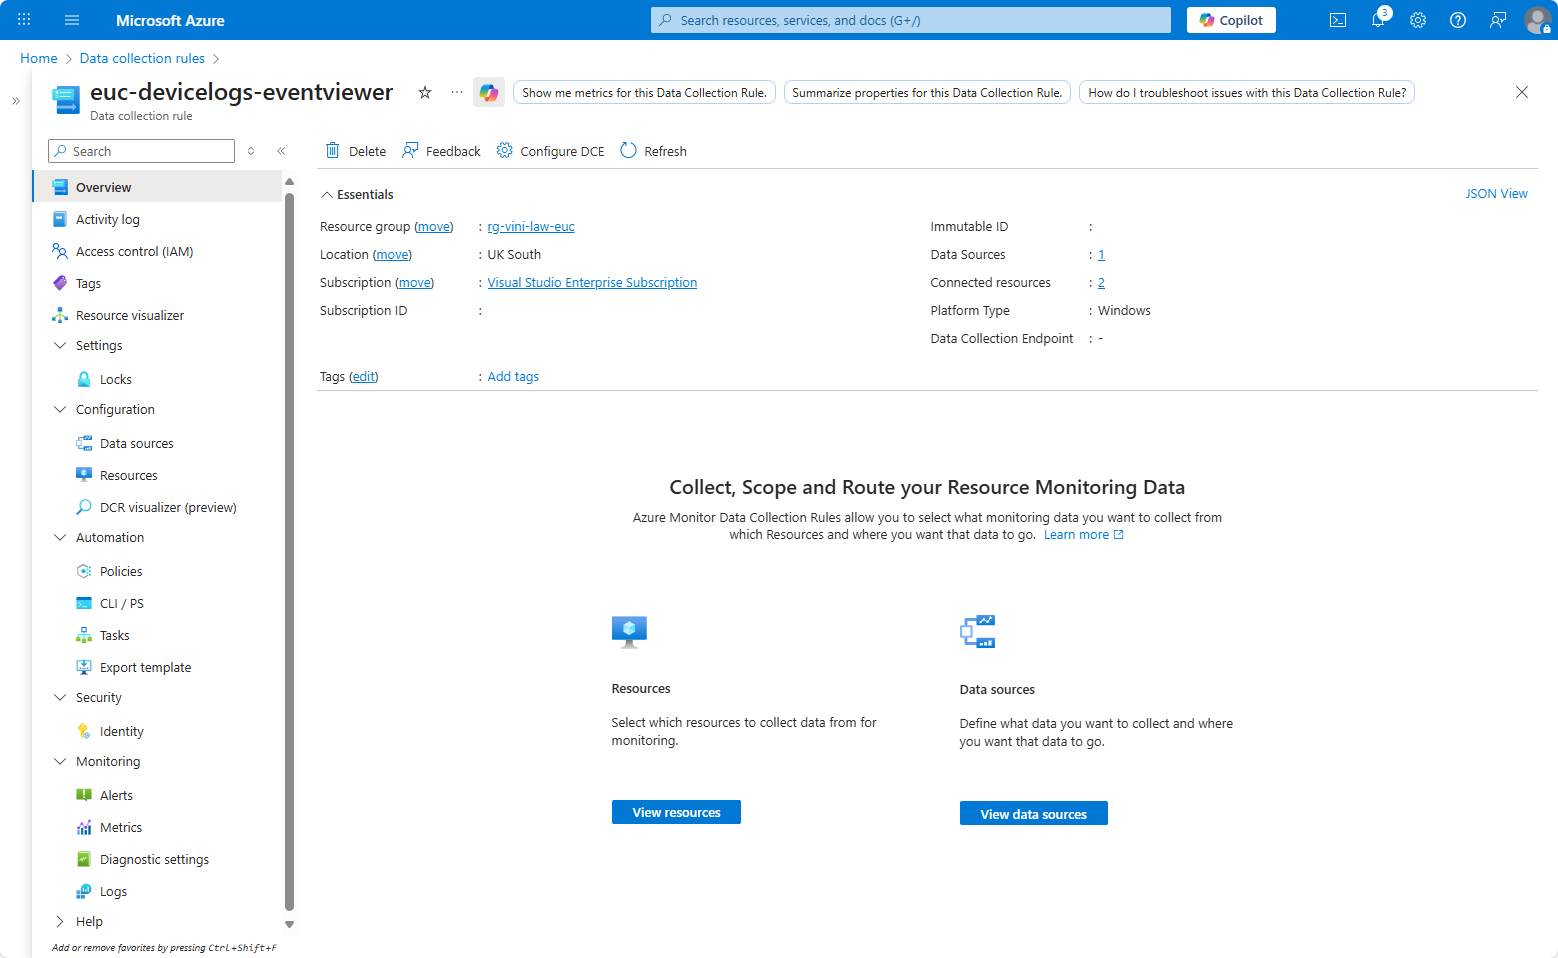
Create the new Data Collection Rule, in this example it is named euc-devicelogs-eventviewer. This is configured to record to the EUC – Log Analytics Workspace – Resource group (rg-vini-law-euc) that was created previously.
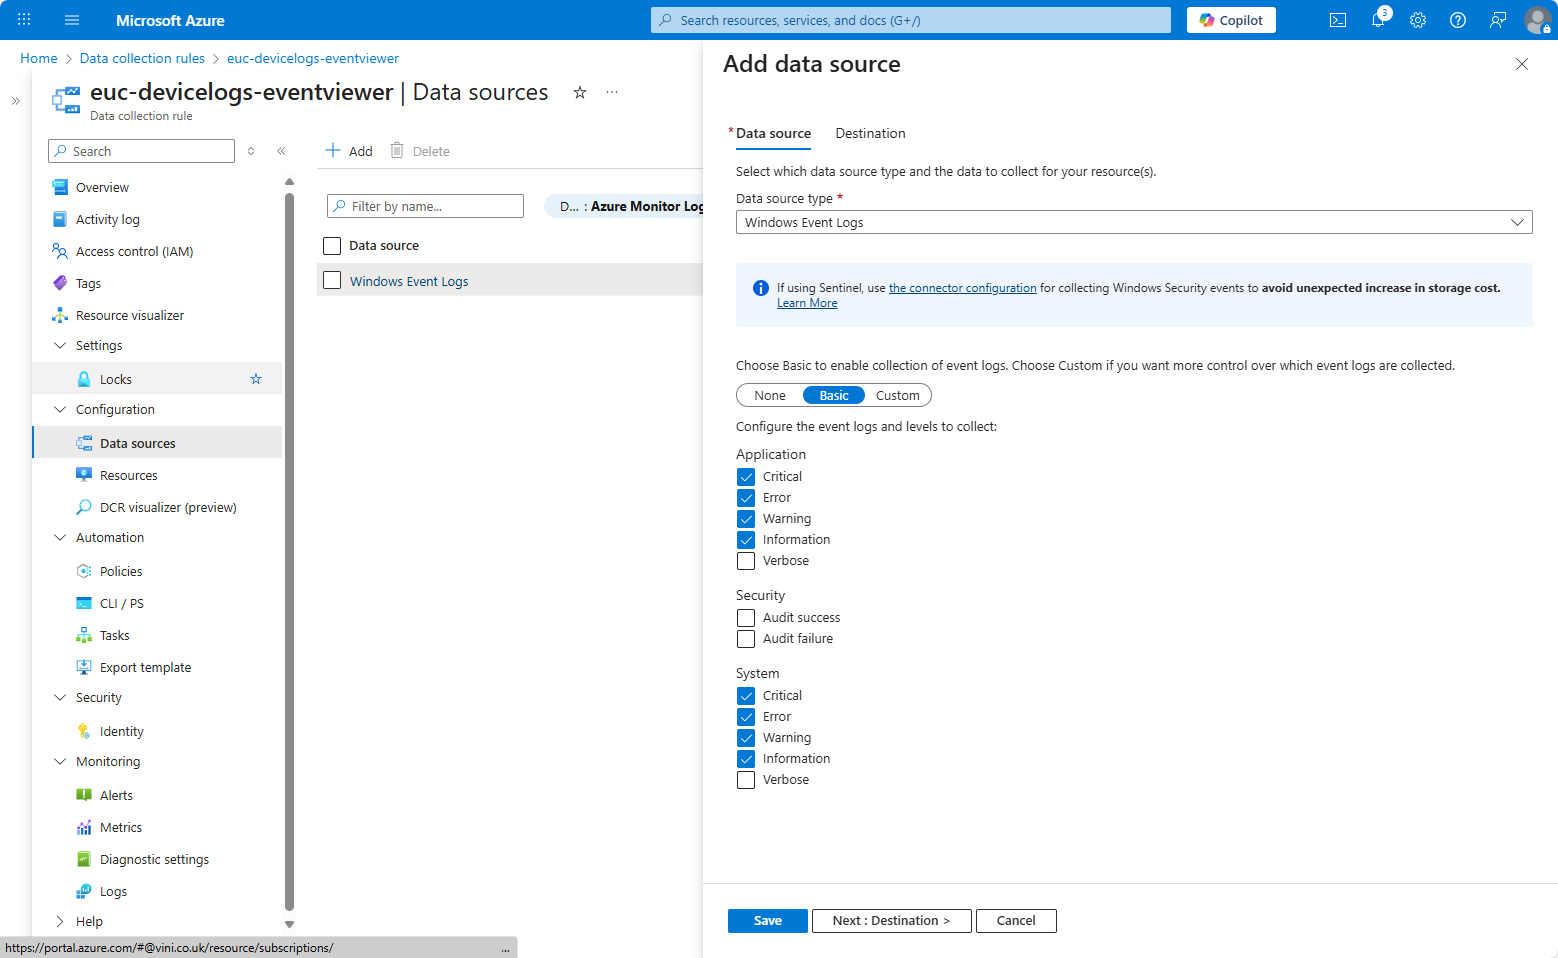
Under Data Sources select Add and choose “Windows Event Logs” as the Data Source Type.
Select which kind of logs you want to collect. The more you collect, the more you’ll effectively pay, as your Log Analytics Workspace will need more space to hold all the data. You probably just want Critical and Error, but that’s up to you.
Save the settings and select the destination. Again, if you don’t have a Destination available, you can create one within the wizard.
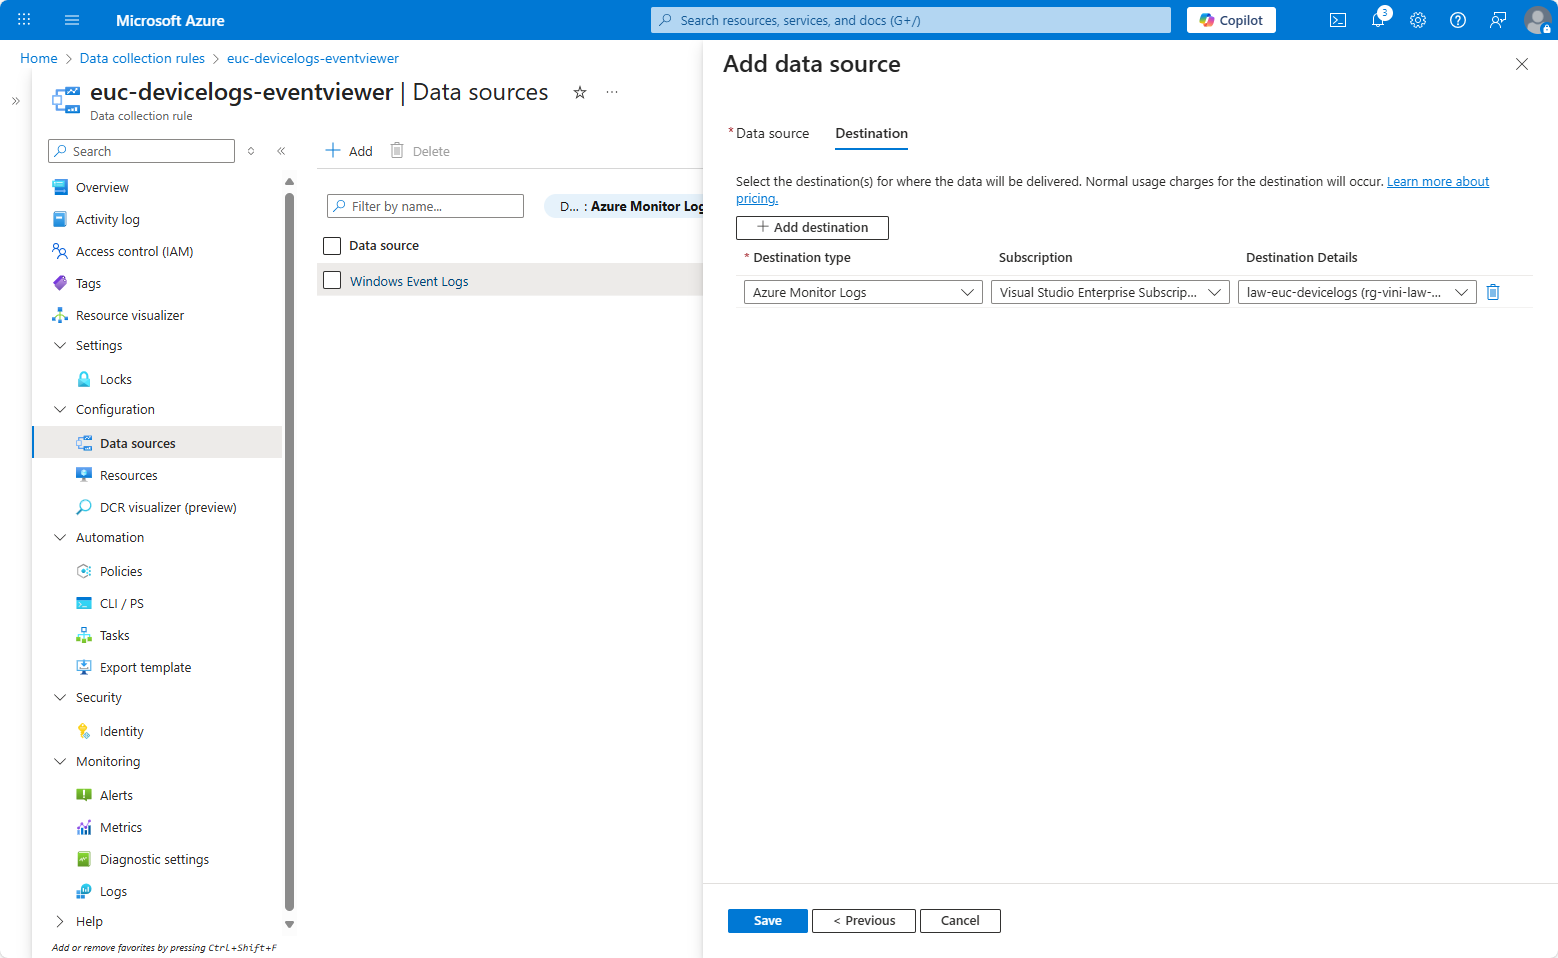
Save the DCR and continue your deployment of the Azure Monitoring Agent.
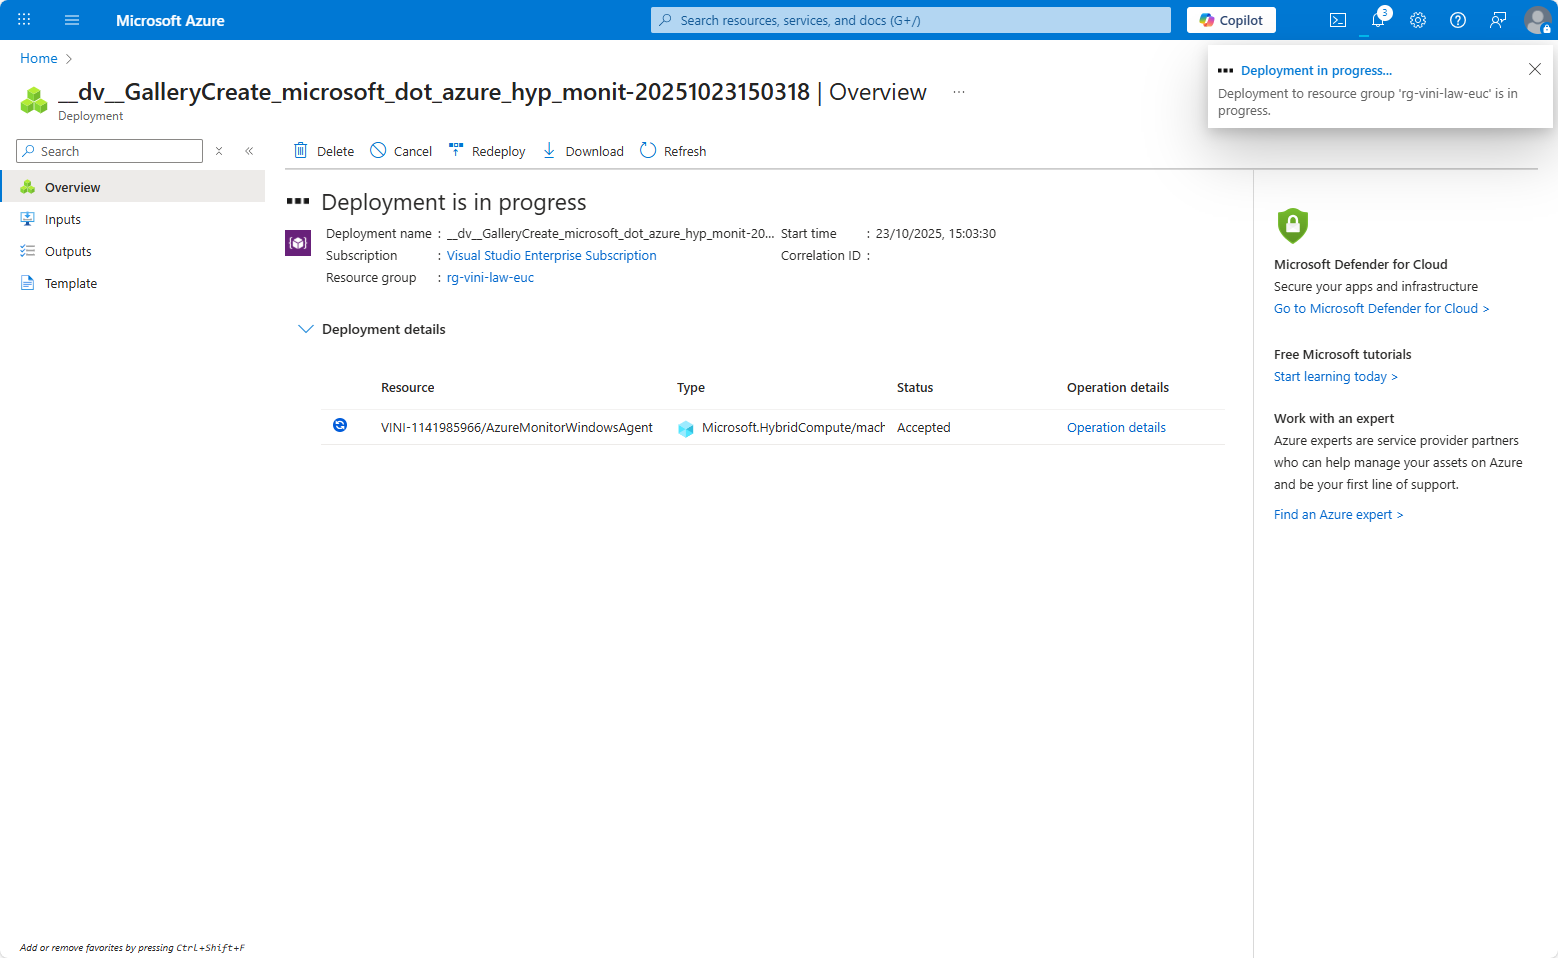
After this completes, you now see that your Azure Arc Machine resource has “Installed” defined under the Monitoring Extension column.
Walk away for an hour or so, and then if you check your LAW shortly afterwards, you should now see that under Logs, we can query a table named Event. Simply typing “Event” and run in the KQL query field will return ALL the event logs from the devices with the monitoring agent installed.
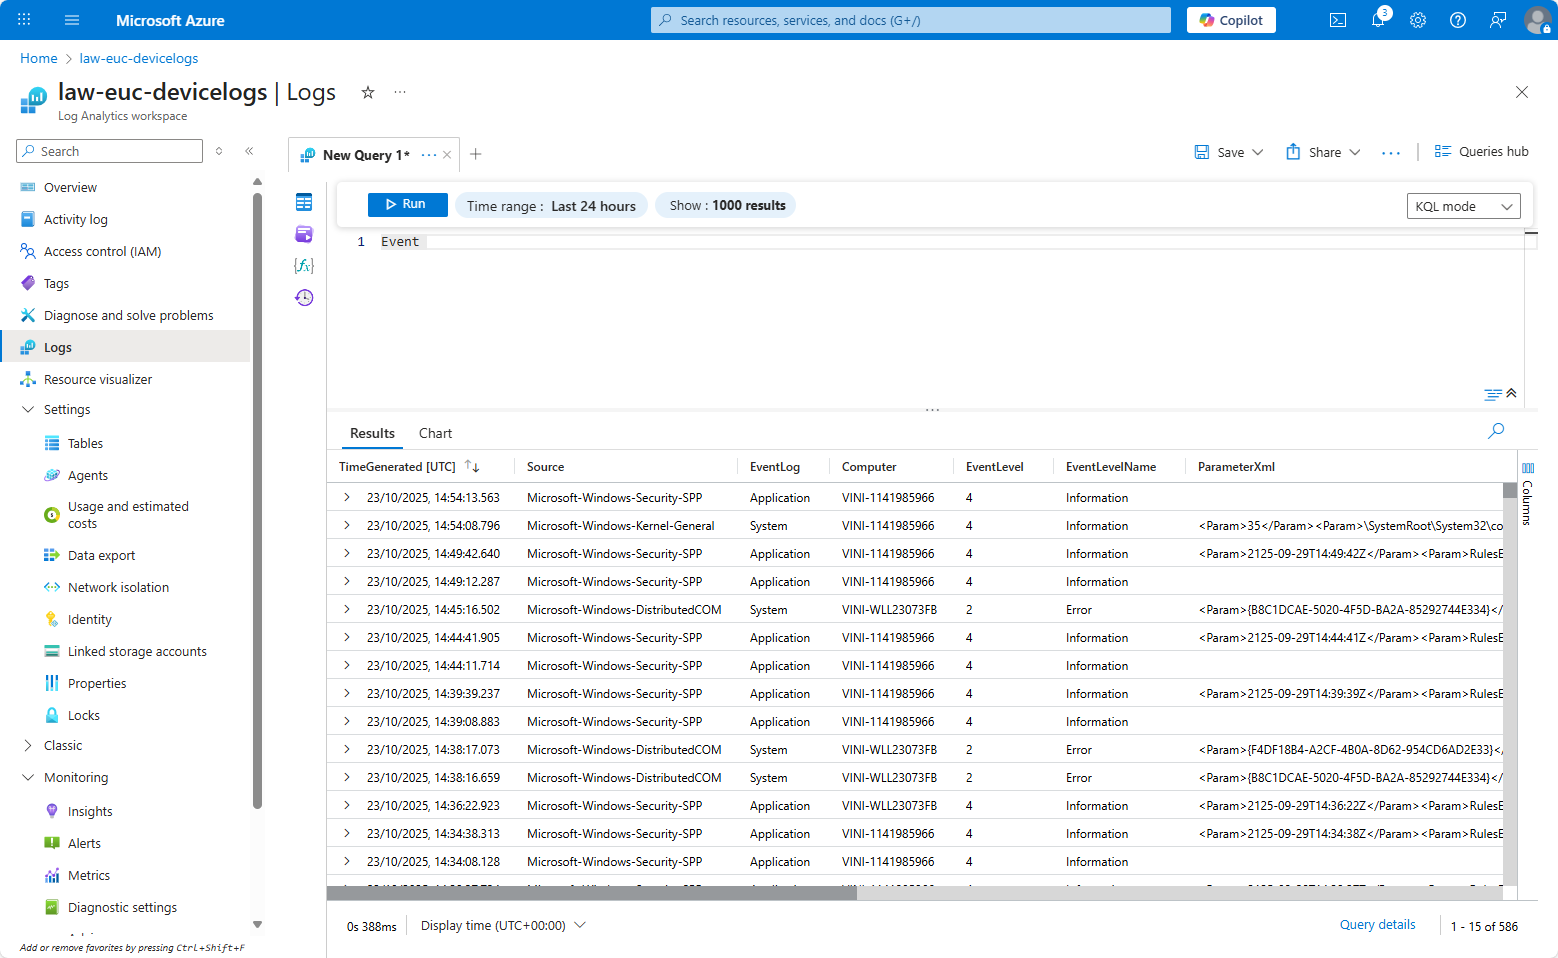
So there you have it, a centralised LAW capturing all your Windows Event Logs…
But then what…?
Leave a Reply